A Bollinger Band is a technical analysis tool defined by a set of trendlines plotted two standard deviations (positively and negatively) away from a simple moving average (SMA) of a security’s price, which can be adjusted to user preferences.

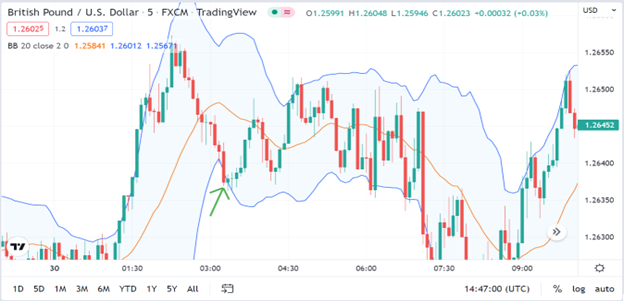
In the above chart, we see the Bollinger bands. This indicator was plotted using a 20-period simple moving average, which is the red line, and two standard deviations (positively and negatively) from the 20 period simple moving average, represented by the blue lines on either side of the 20 period simple moving average.
So how do you use the Bollinger bands in a scalping trading strategy?
Reversals
When price exits either the upper or lower Bollinger bands, it can be seen as a signal for a reversal. This can also signal overbought or oversold conditions in the market. When price moves closer to or exits the upper band, the market is likely overbought, and a reversal is likely to occur. When price moves closer to or exits the lower band, the market is likely oversold, and a reversal will likely occur.
Long Position
A long position entry signal would occur when price exits the lower band of the Bollinger bands. You can also use reversal candlesticks as a confirmation of the signal.

In the image above, we see a long position entry signal at the point marked by the green arrow. Price exits the lower band of the Bollinger bands, followed by a green doji candlestick that acts as a confirmation for our long position entry. A long position opened at that point is profitable as price moves up.
Short Position
A long position entry signal would occur when price exits the upper band of the Bollinger bands. You can also use reversal candlesticks as a confirmation of the signal

In the image above, we see a short position entry signal at the point marked by the red arrow. Price exits the upper band of the Bollinger bands, followed by a green doji candlestick that acts as a confirmation for our short position entry. A short position opened at that point is profitable as price moves down.
- 8 Best Prop Firms USA: Real trader Reviews and Payouts - March 10, 2025
- Forex Trading in Uganda: Start With $10—An Incredible Opportunity on a Tight Budget! - February 24, 2025
- Master Forex Trading Algorithms: Your Path to Success in 2025 - February 17, 2025


