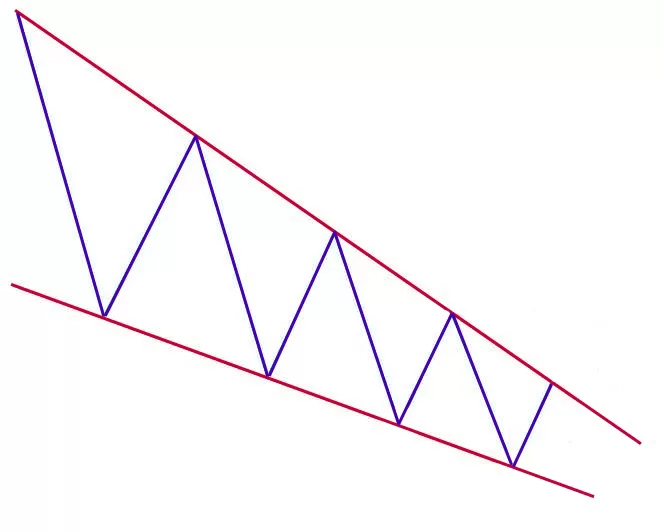
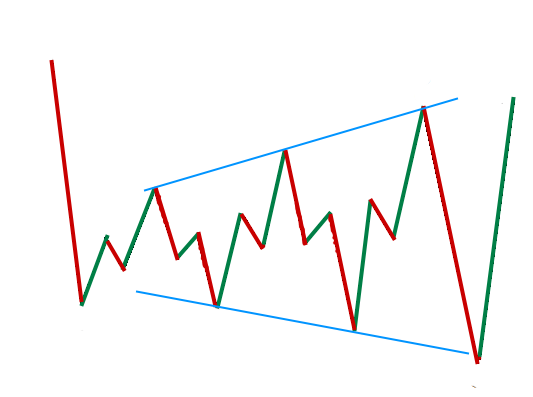
Diamond chart patterns are powerful technical analysis tools that help traders identify potential trend reversals in the financial markets. These patterns, characterized by their diamond-shaped formations on price charts, provide valuable insights into market sentiment and can guide trading decisions.
In this comprehensive guide, we will explore the different types of diamond chart patterns, their characteristics, how to identify them, and strategies for trading them effectively.
What Are Diamond Chart Patterns?
Diamond chart patterns are technical analysis patterns that indicate potential trend reversals in the financial markets. These patterns form on price charts and resemble the shape of a diamond. They are formed by the convergence of two trendlines: an uptrend line (rising lows) and a downtrend line (falling highs). Diamond chart patterns can be bullish or bearish, depending on the preceding trend.
Characteristics of Diamond Chart Patterns
Diamond chart patterns exhibit several distinct characteristics that make them easily identifiable on price charts. These characteristics include:
- Symmetrical shape: Diamond chart patterns have a symmetrical diamond shape with converging trendlines.
- Decreasing volatility: Volatility and oscillations tend to increase during the formation of the pattern’s broadening wedge phase and decrease during the formation of the symmetric triangle phase.
- Preceding trend: Diamond chart patterns are preceded by either a bullish or bearish trend, indicating a potential trend reversal.
- Volume contraction: Trading volume typically decreases as the pattern forms, reflecting indecision among market participants.
Types of Diamond Chart Patterns
There are two main types of diamond chart patterns: the diamond top pattern and the diamond bottom pattern. Each pattern indicates a potential reversal in market sentiment and can guide trading decisions.
Diamond Top Pattern (Bearish Reversal)
The diamond top pattern forms after a prolonged uptrend and signals a potential shift from bullish to bearish sentiment in the market. It is characterized by a series of lower highs and higher lows, forming a diamond shape on the price chart. The breakout from the pattern occurs when the price decisively moves below the lower trendline of the diamond.
Diamond Bottom Pattern (Bullish Reversal)
The diamond bottom pattern forms after a sustained downtrend and suggests a potential reversal from bearish to bullish sentiment. It is characterized by a series of higher lows and lower highs, forming a diamond shape on the price chart. The breakout from the pattern occurs when the price decisively moves above the upper trendline of the diamond.
How to Identify Diamond Chart Patterns
Identifying diamond chart patterns requires a keen eye for price chart analysis. Traders can use several techniques to identify these patterns, including analyzing the symmetrical broadening wedge and the symmetric triangle within the pattern.
Symmetrical Broadening Wedge
The first half of the diamond chart pattern is the symmetrical broadening wedge, which is a continuation pattern. It is characterized by increasing volatility and oscillations, with the price forming a narrowing range of higher highs and lower lows. This phase sets the foundation for the formation of the diamond pattern.
Symmetrical Triangle
The second half of the diamond chart pattern is the symmetric triangle, which is a reversal pattern. It is characterized by decreasing volatility and oscillations, with the price forming a narrowing range of lower highs and higher lows. This phase completes the diamond pattern and provides a clear visual representation of the potential trend reversal.
Example of Diamond Top Chart Pattern
Example of Diamond Bottom Chart Pattern
Trading Strategies for Diamond Chart Patterns
Trading diamond chart patterns requires careful analysis and the use of effective strategies. Here are some key strategies to consider when trading these patterns:
Confirmation and Breakout
To confirm the validity of a diamond chart pattern, traders should wait for a clear breakout from the pattern. The breakout occurs when the price decisively moves above the upper trendline (for a diamond bottom) or below the lower trendline (for a diamond top). Increased trading volume during the breakout can provide additional confirmation of the reversal.
Setting Stop-Loss and Take-Profit Levels
Setting appropriate stop-loss and take-profit levels is crucial for managing risk and maximizing profits. Traders can set a stop-loss order above the recent swing high (for a diamond top) or below the recent swing low (for a diamond bottom) to limit potential losses. Take-profit levels can be determined by measuring the width of the diamond pattern and projecting it in the direction of the breakout.
Using Additional Technical Indicators
Traders can enhance their analysis by incorporating additional technical indicators. Moving averages, relative strength, and oscillators can provide valuable insights into market momentum and confirm the signals provided by the diamond chart pattern.
Statistical Analysis of Diamond Chart Patterns
Statistical analysis of diamond chart patterns can provide valuable insights into their effectiveness and reliability. According to historical data:
- Diamond tops have a bullish breakout in 82% of cases, indicating a potential trend reversal from bearish to bullish sentiment.
- Diamond bottoms have a price objective reached in 79% of cases, suggesting a potential trend reversal from bearish to bullish sentiment.
Common Mistakes to Avoid
When trading diamond chart patterns, it is essential to avoid common mistakes that can undermine trading success. Some common mistakes include:
- Failing to wait for a clear breakout from the pattern before entering a trade.
- Neglecting to set appropriate stop-loss and take-profit levels to manage risk.
- Overlooking the use of additional technical indicators to confirm signals.
- Neglecting to consider the broader market context and fundamental factors that may influence price movements.
Diamond Tops vs. Diamond Bottoms
Diamond tops and diamond bottoms are two sides of the same coin, representing potential trend reversals in opposite directions. While diamond tops indicate a potential shift from bullish to bearish sentiment, diamond bottoms suggest a potential shift from bearish to bullish sentiment. Traders should be aware of these distinctions and adjust their trading strategies accordingly.
Benefits and Limitations of Diamond Chart Patterns
Diamond chart patterns offer several benefits to traders, including:
- Clear visual representation of potential trend reversals.
- Ability to identify key levels of support and resistance.
- Potential for high-profit opportunities during breakout movements.
However, it is important to recognize the limitations of diamond chart patterns, including:
- Relatively low frequency of occurrence compared to other chart patterns.
- Difficulty in accurately identifying and confirming the patterns.
- The possibility of false breakouts and failed reversals.
Conclusion
Diamond chart patterns are valuable tools for traders seeking to identify potential trend reversals in the financial markets. By understanding the characteristics, identification techniques, and trading strategies associated with these patterns, traders can enhance their analysis and make more informed trading decisions. However, it is crucial to exercise caution and use additional technical indicators to confirm signals and manage risk effectively.
- 8 Best Prop Firms USA: Real trader Reviews and Payouts - March 10, 2025
- Forex Trading in Uganda: Start With $10—An Incredible Opportunity on a Tight Budget! - February 24, 2025
- Master Forex Trading Algorithms: Your Path to Success in 2025 - February 17, 2025


