Double/multiple tops are characterized by resistance points while double/multiple bottoms are characterized by support points. These are some of the most used chart patterns.
These chart patterns can be used as scalping strategies as they appear frequently and yield quick results.

As we can see in the image, double top occurs when the price reaches a certain high point, retraces/reverses and then rallies back to a similar high point and then declines. Therefore, price will hit a certain resistance point twice.
A double bottom occurs when the price reaches a certain low point, retraces/reverses and then decreases again back to a similar low point and then increases. Therefore, price will hit a certain support point twice.
A double top signals a sell at the neckline while a double bottom signals a buy at the neckline.
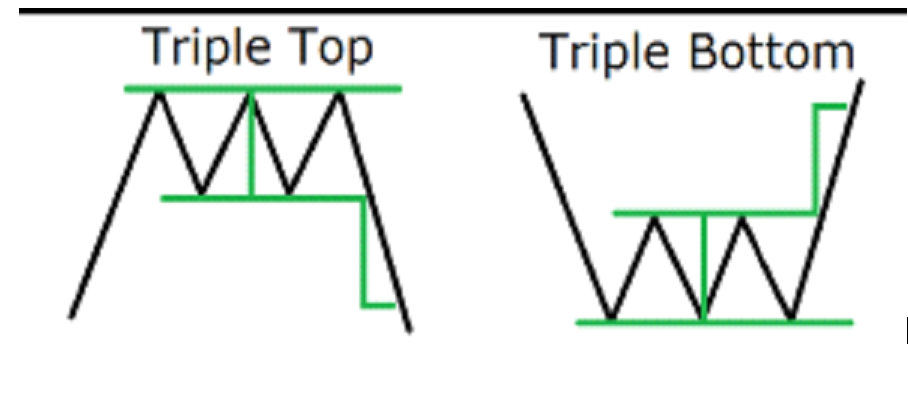
Other than double tops and bottoms there can also be multiple tops and bottoms such as a triple top or triple bottom. This simply implies that price hit a certain resistance or support point not twice but thrice.

The image above shows how a triple top and triple bottom would look. We can see that price hits the resistance point thrice for a triple top and price hits the support point thrice for a triple bottom.
Now let us take a look at some examples of multiple tops and bottoms on 5 minute charts.

In the image above we see a double bottom pattern. Price drops hits a certain support zone then increases and hits a certain resistance zone before dropping once again and hitting the previous support zone and then bouncing back up. The area shaded in red is the neckline of the pattern and a long position should only be opened once price breaks through the resistance at the neckline. As shown in the image price then increases once it breaks through the neckline therefore a long position opened at that point is profitable.

In the image above we see a double top pattern. Price rises hits a certain resistance zone then declines and hits a certain support zone before rising once again and hitting the previous resistance zone and bouncing off and decreasing. The area shaded in red is the neckline of the pattern and a short position should only be opened once price breaks through the support at the neckline. As shown in the image price then declines once it breaks through the neckline therefore a short position opened at that point is profitable.
- 8 Best Prop Firms USA: Real trader Reviews and Payouts - March 10, 2025
- Forex Trading in Uganda: Start With $10—An Incredible Opportunity on a Tight Budget! - February 24, 2025
- Master Forex Trading Algorithms: Your Path to Success in 2025 - February 17, 2025


