The head and shoulders pattern is one of the most popular and reliable chart patterns used in technical analysis. It is a reversal pattern that can signal a change in trend from bullish to bearish or vice versa. In this comprehensive guide, we will explore the structure of the head and shoulders pattern, how to identify it on a chart, and how to effectively trade it for profit.
What is the Head and Shoulders Pattern?
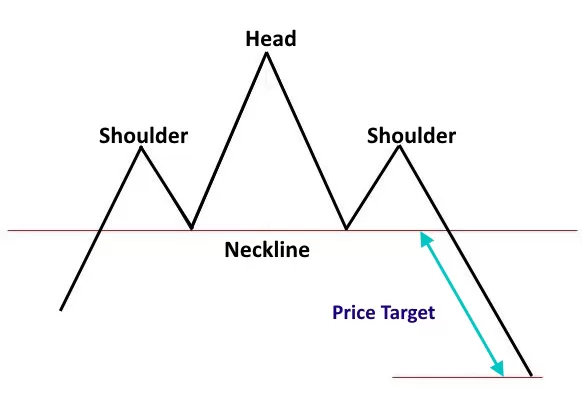
The head and shoulders pattern consists of three main components: the head, the shoulders, and the neckline. It can be seen as a baseline with three peaks, where the middle peak (the head) is higher than the two outer peaks (the shoulders). This pattern is known as a reversal pattern because it often occurs at the end of an uptrend or a downtrend.
The Head and Shoulders Pattern
In the head and shoulders pattern, the first peak represents the left shoulder, the second is the head, and the third is the right shoulder. The neckline is drawn by connecting the lows of the two troughs formed between the peaks. The slope of the neckline can be either upward or downward, with a downward slope being more reliable.
The Inverse Head and Shoulders Pattern
The inverse head and shoulders pattern is the opposite of the traditional pattern. It occurs at the end of a downtrend and signals a potential reversal to an uptrend. In this pattern, the first trough represents the left shoulder, the second trough is the head, and the third trough represents the right shoulder. The neckline is drawn by connecting the highs of the two peaks formed between the troughs.
Spotting the Head and Shoulders Pattern
Identifying the head and shoulders pattern on a chart can be challenging, but with practice, it becomes easier. To spot this pattern, look for three distinct peaks or troughs, with the middle peak or trough being the highest or lowest point. The shoulders should be at similar levels, although slight variations are acceptable. The neckline is drawn by connecting the lows of the shoulders in the traditional pattern or the highs of the shoulders in the inverse pattern.
Strengths and Weaknesses of the Head and Shoulders Pattern
The head and shoulders pattern offers several strengths, making it a reliable tool for traders. One of its greatest advantages is the clearly defined risk and reward levels. Traders can set their stop-loss orders above or below the neckline, depending on the direction of the pattern. Additionally, the pattern provides a target for profit-taking by measuring the distance between the head and the neckline.
However, the head and shoulders pattern also has its limitations. In strong trending markets, the price may continue in the same direction despite the formation of the pattern. It is essential to consider the overall market conditions and use additional technical indicators or confirmations to increase the accuracy of the pattern.
Drawing the Head and Shoulders Pattern
Drawing the head and shoulders pattern accurately is crucial for successful trading. Start by identifying the three main components: the head, the shoulders, and the neckline. The head should be the highest or lowest point, with the shoulders on either side at similar levels. Draw the neckline by connecting the appropriate points, either the lows or highs of the shoulders.
How to Trade the Head and Shoulders Pattern
Trading the head and shoulders pattern requires careful execution and risk management. Based on this pattern, two common approaches to entering a trade are the breakout entry and the throwback entry.
The Breakout Entry
With the breakout entry, traders enter the trade as soon as the price breaks below the neckline in the traditional pattern or above the neckline in the inverse pattern. This entry strategy offers the advantage of not missing a trade, but it carries a higher risk of false breakouts.
The Throwback Entry
The throwback entry strategy involves waiting for a retest of the neckline after the breakout. Traders enter the trade when the price pulls back to the neckline and shows signs of reversal. This approach reduces the risk of false breakouts but may result in missing some trades if the price does not retest the neckline.
Regardless of the entry strategy chosen, it is crucial to set a stop-loss order above or below the neckline to limit potential losses. The take-profit target can be determined by measuring the distance between the head and the neckline and projecting it from the breakout point.
Examples of Trading the Head and Shoulders Pattern
Let’s look at two examples of trading the head and shoulders pattern to illustrate the concepts discussed.
Example 1: Traditional Head and Shoulders Pattern
This example shows a traditional head and shoulders pattern in this chart. The price initially rises to form the left shoulder, then creates a higher peak as the head, and finally forms the right shoulder at a lower level. The neckline is drawn by connecting the lows of the shoulders. Once the price breaks below the neckline, a short trade can be initiated with a stop-loss order placed above the neckline and a take-profit target set based on the distance between the head and the neckline.
Example 2: Inverse Head and Shoulders Pattern
This example shows an inverse head and shoulders pattern in this chart. The price initially falls to form the left shoulder, then creates a lower low as the head, and finally forms the right shoulder at a higher level. The neckline is drawn by connecting the highs of the shoulders. Once the price breaks above the neckline, a long trade can be initiated with a stop-loss order placed below the neckline and a take profit target set based on the distance between the head and the neckline.
Conclusion
The head and shoulders pattern is a powerful tool for identifying trend reversals in the financial markets. Traders can capitalize on profitable opportunities by understanding its structure, spotting it on a chart, and effectively trading it. Remember to consider the strengths and weaknesses of the pattern, draw it accurately, and use appropriate entry and exit strategies to maximize your trading success.
Optimize your trading achievements with FundedNext: Seize the opportunity to trade up to $300,000 on a FundedNext Account and potentially earn up to 95% of the profits
- 8 Best Prop Firms USA: Real trader Reviews and Payouts - March 10, 2025
- Forex Trading in Uganda: Start With $10—An Incredible Opportunity on a Tight Budget! - February 24, 2025
- Master Forex Trading Algorithms: Your Path to Success in 2025 - February 17, 2025


