A trend reversal chart pattern is the graphical representation of market sentiment change in a trading instrument’s overall direction.
In a bullish market, price reverses, indicating a shift to a bearish market, while in a bearish market, it reverses to a bullish market.
Along with candlestick patterns, naked chart or price action traders love price patterns because they provide a signal to enter or exit a trade, just like traffic lights signal a stop or go.
There are various trend reversal chart patterns, but we will focus on the top five price reversal chart patterns in this article.
Top 5 Trend Reversal Chart Patterns.
1.Head And Shoulders Pattern
The head and shoulders pattern is a popular reversal pattern among price action traders.
With some screen time, you will easily spot it.

The chart above illustrates the head and shoulders pattern.
The pattern forms just after an uptrend.
Prices push upward with high momentum to form a new high (shoulder 1); it drops, then shoots up again above shoulder one to a new high we call the head.
It drops again, bouncing off the previous low (the neckline) to the same level of shoulder 1.
The lower peaks on both sides of the head are known as shoulders.
A neckline is drawn by joining the lowest levels of the two troughs on both sides of the head.
As prices breakout and plummet down the neckline at the right shoulder, it indicates that the initial trend is about to reverse. It predicts a downtrend.
How To Trade The Head And Shoulders Pattern
Once you see the head and shoulders pattern form on your chart.
Entry: Prepare to enter a sell order or go short when the price breaks out beneath the neckline.
Stop loss: Set the stop loss a few pips above the head or the shoulder, depending on your risk-reward.
Take profit: Set your take profit in the next support level or based on your Risk Reward
2.Inverse Head And Shoulders Chart Pattern
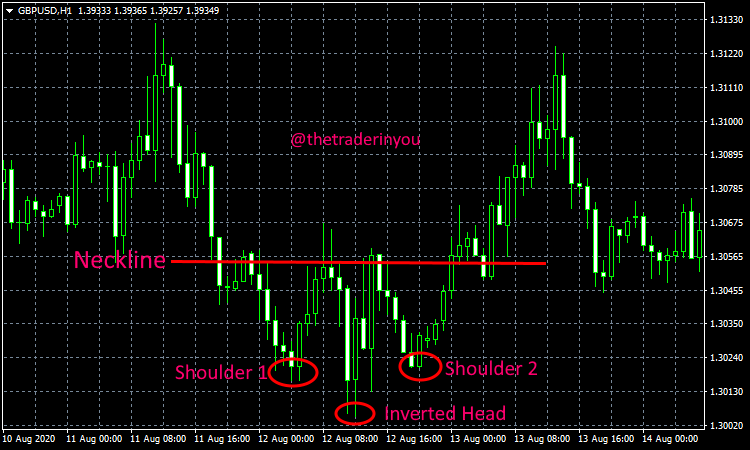
The inverse head and shoulders pattern is similar to a standard head and shoulders pattern; the only difference is how they print on the chart.

The inverse head and shoulders pattern prints towards the end of a bearish market signaling a likely trend reversal.
Like you can see from the chart above, the price is going down. It drops, forming the first shoulder, bounces up, drops again, trading at the lowest to the other candles (the head) before it shoots up, dropping again along the neckline to form the second shoulder.
How To Trade The Inverse Head And Shoulders Pattern
Entry: Enter a buy order when the price from shoulder 2 breaks out above the neckline.
Stop loss: Set the stop loss a few pips below the head or the second shoulder or depending on your risk-reward ratio.
Take profit: Set your take profit at the next resistance level or based on your Risk Reward
3.Double Tops Chart Pattern
The double tops chart pattern forms when price hits almost the same level twice before reversing.

The double tops reversal chart pattern indicates a reversal from an uptrend.
These are the highest highs recorded after a bullish run, where prices record a powerful resistance level.
When an asset’s price shoots up in an uptrend, the price gets to the apex before reversing to find support – the neckline, from which it bounces off shooting up again.
This time, price is incapable of surpassing the first recorded high, thereby recording a second high, with the second high forming what we see as the double tops chart pattern.
How To Trade The Double Tops Chart Pattern
Entry: Prepare to enter a sell order or go short when price breaks out beneath the neckline.
Stop loss: Set the stop loss a few pips the double tops.
Take profit: Set your take profit in the next support level or based on your Risk Reward
4.Double Bottoms Chart Pattern
The double tops is another reliable reversal chart pattern.
The pattern indicates a change in price direction from bearish to bullish, a reversal from a downtrend to an uptrend.
The double bottoms reversal pattern is practically the opposite of the double top reversal pattern.

The pattern is formed in a price tug-of-war between sellers and buyers; buyers overpower the sellers ending a downtrend.
The formation is confirmed when prices break above the neckline, from where you should look for trading opportunities.
How To Trade The Double Bottoms Price Reversal Chart Pattern
Entry: Set a pending buy order above the neckline or enter a buy when price breaks out above the neckline.
Stop loss: Set the stop loss a few pips below the double bottoms.
Take profit: Set your take profit around the next resistance level or based on your Risk Reward
5.Triple Tops Price Reversal Chart Pattern
The triple tops reversal pattern is a bearish reversal pattern similar to the double top pattern, only that it prints three tops instead of two in the double tops.

The three tops create a resistance level that price fails to break after three repeated strikes.
The three tops should be almost at the same level, not at the same level but close enough.
A support level is also formed along the neckline.
The triple tops reversal is only confirmed when price breaks through this support (neckline) level triggering selling opportunities.
How To Trade The Triple Tops Chart Reversal Pattern
Entry: Prepare to enter a sell order or go short when price breaks out beneath the neckline.
Stop loss: Set the stop loss a few pips above the triple tops.
Take profit: Set your take profit in the next support level or based on your Risk Reward
Your assignment; how to find trend reversal chart patterns on any chart.
Pullup any chart, scroll backward (you may want to disable the Chart Autoscroll).
Pay attention to levels when there is a clear change from a downtrend to an uptrend and vice versa.
Notice the chart formations.
That’s the easiest way you can learn how to read and notice reversal chart patterns.
It may take a while to get into the rhythm for new traders, but even for expert traders, you will notice chart patterns take ages to print, but when they do, you get high probability entries.
In the meantime, master the candlestick chart patterns.
If you go through the chart scrolling exercise above, you will notice candlestick patterns are more reliable and frequent than general chart patterns.
- Essential Guide to Forex Market Analysis Techniques for Traders - January 30, 2026
- Complete Guide to Selecting Trustworthy Forex Brokers and Platforms - January 28, 2026
- Ultimate Guide to Advanced Trading Strategies for Forex Success - January 26, 2026


