Let’s take a look at some of the best and reliable candlestick patterns that actually work for day traders.
We’ll learn how to interpret these candlestick chart patterns and apply them to our daily trading.
One of the attractions of retail trading is freedom. You choose when to trade. What to trade. And how to trade.
You have the liberty to take a trade based on a flip of a coin, an indicator, a candlestick, a tip from a forum, or one of the other thousand ways to make trade decisions.
But when we talk consistent, profitable, disciplined trader.
We think making trade decisions based on proven, reliable, and predictable methods.
To a pure price action trader, candlesticks are the holy grail- they are proven, reliable, and predictable.
What are candlesticks?
A candlestick is a representation of price in a chart.
Individually, a candlestick shows how far price moved in a selected period.
On a daily chart – one candlestick represents the total price movement in one day.
On a one hour chart, a candlestick represents the worth of price in an hour, and so does a 5-minute chart.
How to interpret or read a candlestick chart pattern.

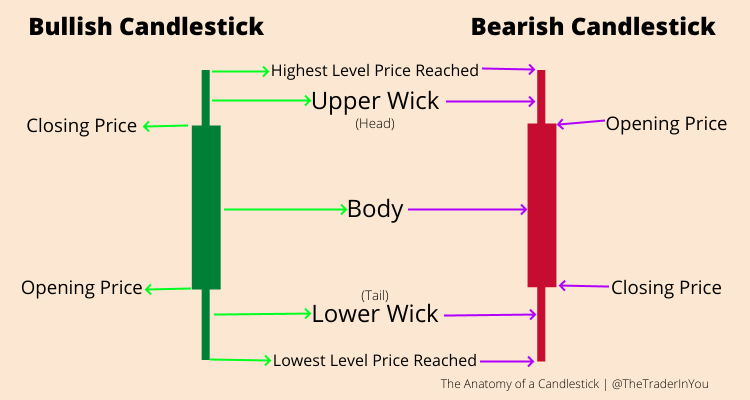
A candlestick has three parts.
- The head or upper wick.
- The body
- The tail or shadow or lower wick
Like we mentioned earlier, it shows the whole movement of price in the selected timeframe.
It also shows the opening and closing prices.
Finally, it shows the highest and lowest points price reached in the selected timeframe.
In a bullish trend, we call them bullish candlesticks, while in a bearish trend, we call them bearish candlesticks.
The difference between these two candlesticks is the opening and closing price.
On the bullish candlestick, price closes above the opening price.
While the bearish candle, price closes below the opening price.
A short history of candlesticks.
Steve Nison popularized the candlesticks you see the first time you run your MetaTrader platform in his book Japanese Candlestick Charting Techniques: A Contemporary Guide to the Ancient Investment Techniques of the Far East.
But the origin is credited to Homma Munehisa (1724-1803), a Japanese rice merchant.
That’s why we call them Japanese candlesticks.
Importance of understanding candlestick patterns individually.
Thomas Bulkowski, in his book Encyclopedia of Candlestick Charts, provides a clear analogy of the importance of understanding candlesticks in isolation.

Like how diverse boys come, candlesticks come in a variety of sizes and shapes.
The guys I met on the street today are different because of genetic makeup, foods they eat, the lifestyle they live, and more.
Each candlestick is also unique because of its formation.
In other words, it is a graphical interpretation of price by the traders who traded at that time.
What are candlesticks chart patterns?
Looked at as a cluster, individual candlesticks form patterns – candlestick chart patterns.
It is such patterns that technical traders study to gauge the future direction of price.
That simply means if you are a technical trader, you need to know chart patterns and the candlesticks that form these chart patterns.
Types of candlestick patterns.
What do we know about price?
It is going up or going down or going nowhere.
Candlesticks are the best indicators for where it is going.
That is why they are the crown jewel of price action trading.
Broadly, we have
- Reversal Candlestick patterns
- Continuation Candlestick patterns
Reversal Candlestick patterns
Every trend comes to an end.
How do you know a trend is coming to an end?
You guessed it – price reversal candlestick patterns.
Under the reversal candlestick patterns we have;
- Bearish candlestick patterns
- Bullish candlestick patterns
Bearish candlestick patterns
These patterns signal a bullish upward trend is coming to an end.
When you see these patterns on your charts, prepare to place your sell orders.
The Shooting Star Candlestick Pattern.
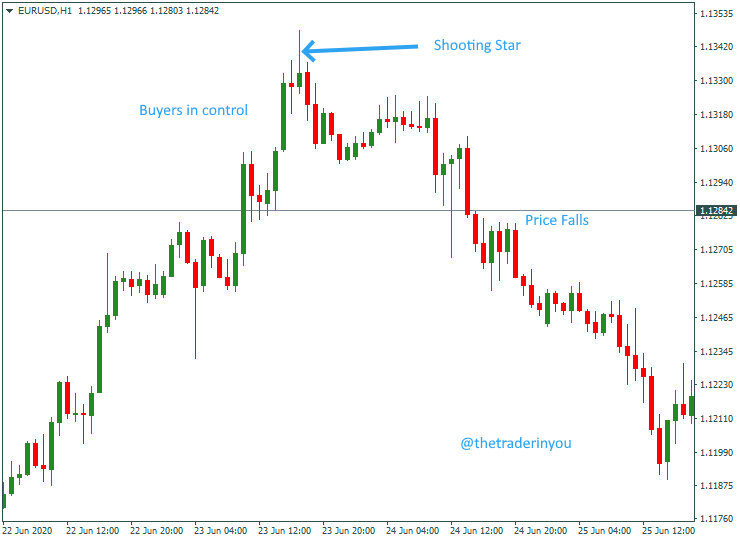
The Shooting Star candlestick pattern is easy to spot on a chart.

The open and close prices are near the lower wick of the candle.
The candle has a small body and a long head or upper wick that sticks past the candles surrounding it.
Interpreting the Shooting Star Candlestick Pattern.
The Shooting Star signals an upward trend is about to reverse.
Buyers push prices higher than the surrounding candles, but sellers quickly drive the price back, eventually closing below the opening price.
Price continues to drop in the next candles.
The Evening Star Candlestick Pattern.
The evening star prints so often in charts, and it is easy to spot at the end of an uptrend.

It has a very tiny tail, tiny body, and a small head.
It sits sandwiched between a big bullish candle on the left and a big bearish candle on the right.
Interpreting the Evening Star Candlestick Pattern.
The evening star prints on a chart when buying momentum is losing strength.
The biggest candle on the left is bullish.
Price stagnates in the morning star candle.
Buyers then jump in and print a large bearish candle on the right.
The Bearish Engulfing Candlestick Pattern
Also called the Big Shadow candlestick Pattern – the Bearish Engulfing Candlestick Pattern is a two-candle stick pattern.

Another popular candlestick pattern that signals bears are about to takeover.
Characteristics of a Bearish Engulfing Candlestick Pattern
The first candle is bullish.
The second candle is bearish.
The second candle is bigger than the first candle.
The second candle is often the biggest candle the market has seen in a while.
Interpreting the Bearish Engulfing Candlestick Pattern
In the first candle, price opens low and closes higher – typical in an uptrend when buyers are dominant.
But in the second candle, price opens high, but sellers push price high below the low of the first candle.
That way, the first candle looks like a shadow of the second candle.
The Hanging Man Candlestick Pattern
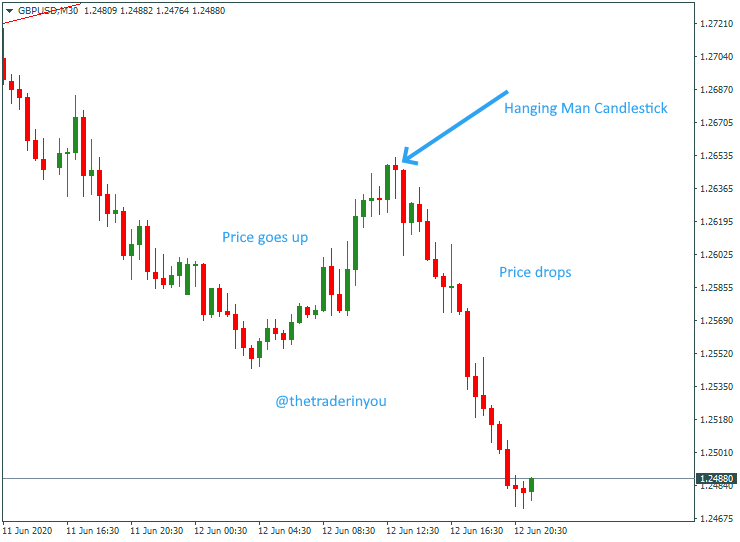
The hanging man is a bearish candlestick formation signaling the end of a bullish uptrend.
It takes the shape of the hammer candlestick pattern, only that it prints in an uptrend.

Characteristics of a Hanging Man Candlestick Pattern
It has a small body.
It has a long tail – at least 2-3 times the size of the body.
It has no or a very short upper wick.
Interpreting the Hanging Man Candlestick Pattern
When an uptrend is losing steam.
Sellers kick in to drive the price down.
Buyers hanging onto control move the price back up, but not high enough beyond the opening price.
This prints a candle that looks like a man hanging on a rope.
Because of the sharp drop in prices, the hanging man indicates that sellers will soon take charge.
Bullish Candlestick Patterns
The hammer Candlestick Pattern.
Also known in certain circles as the Kangaroo tail.

The hammer candlestick pattern is probably the easiest to spot on a chart.
The open and close prices are near the end of the candle.
The candle has a small body and a long tail or shadow or wick.
The tail sticks out past the candles surrounding it.
How to Interpret the hammer Candlestick Pattern.
The hammer often signals a downward trend is about to reverse.
Sellers push price lower than the surrounding candles, but buyers quickly drive the price back, eventually closing above the opening price.
Price continues to rally up in the next candles.
The Inverted Hammer Candlestick Pattern.
The inverted hammer is a bullish reversal candlestick pattern.
A reflection of the hammer candlestick pattern.
The open and close prices are near the bottom of the candle.
The candle has a small body and a long tail or shadow or wick.
How to Interpret the Inverted hammer Candlestick Pattern.

Price opens lower than the opening price of the previous candle before buyers push it upwards.
Immediately, sellers drive the price towards the opening price.
Hence we have a longer upper wick, a small body, and a short or no lower wick.
Signaling likely change in direction with buyers in control.
Price proceeds to shoot up in the next candles.
The Morning Star Candlestick Pattern.
The morning star prints so often in charts, and it is easy to spot.
It has a very tiny tail, tiny body and a tiny head.
It sits sandwiched between a big bearish candle on the left and a big bullish candle on the right.
Interpreting the Morning Star Candlestick Pattern.

The morning star prints immediately tired sellers make a final push down of price.
The left candle is bearish.
In the next candle, price trades in a tight range – barely moving.
Buyers then jump in the third candle driving prices up to print a big bullish candle.
Bullish Engulfing Candlestick Pattern
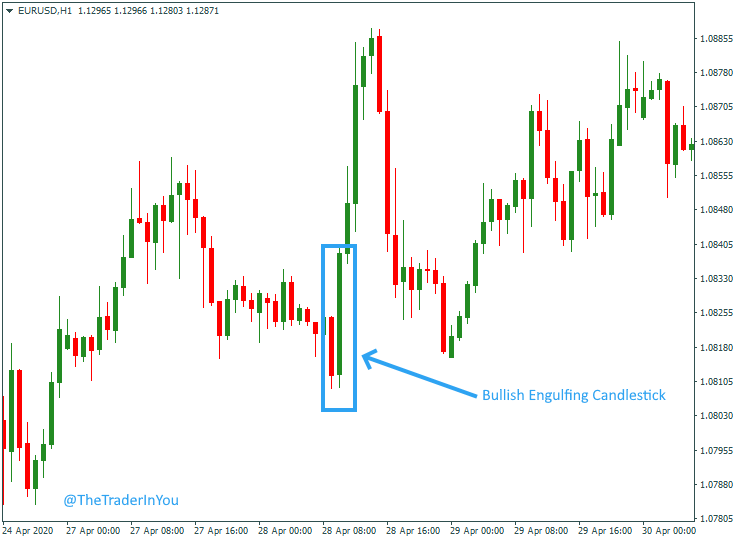
Also called the Big Shadow candlestick Pattern – the Bullish Engulfing Candlestick Pattern is a two-candle stick pattern.
Another popular candlestick pattern that signals change in trends.
Characteristics of a Bullish Engulfing Candlestick Pattern

The first candle is bearish.
The second candle is bullish.
The second candle is bigger than the first candle.
The second candle is often the biggest candle the market has seen in a while.
Interpreting the Bullish Engulfing Candlestick Pattern
In the first candle, price opens high and closes lower – typical with a downtrend when sellers are dominant.
But in the second candle, price opens lower, but buyers push price high above the high price of the first candle.
That way, the first candle looks like a shadow of the second candle.
Wrap up on Candlestick Chart Patterns
I’ve shown you the most reliable reversal candlestick patterns.
We’ll later look at continuation candlestick patterns.
What you should however keep in mind, is that these very patterns can signal a price continuation depending on where on the charts they print.
Also, note that candlestick patterns are only valid in the timeframe they appear in.
If you are looking at the morning star on a 4-hour chart, then it is only useful on the 4-hour chart.
They are only valid as soon as they appear on the chart.
These candlestick patterns are most reliable and lethal around support and resistance zones.
That said, you shouldn’t trade these patterns in isolation.


