Regarding technical analysis, chart patterns are crucial in identifying potential reversal points and providing insights for profitable trades. One such pattern is the rounding top and bottom, which can indicate the end of an uptrend or downtrend, respectively.
Understanding how to recognize and interpret these patterns can empower traders to develop effective strategies for trading in both rising and falling markets.
In this comprehensive guide, we will explore the characteristics, identification guidelines, implications, and trading strategies associated with rounding tops and bottoms.
What are Rounding Tops and Bottoms?
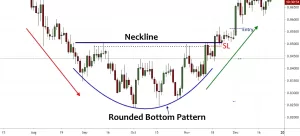
Rounding tops and bottoms are chart patterns that signify potential reversals in the price trend. A rounding bottom, also known as a saucer or a ‘U’ formation, appears as a gradual increase in price over time, indicating the end of a downtrend and the potential start of an uptrend.
Rounding Bottom Chart Pattern
On the other hand, a rounding top, also referred to as an inverse saucer or an inverted ‘U’ shape, shows a gradual decrease in price, suggesting the end of an uptrend and the possibility of a downtrend.
Identifying Rounding Tops and Bottoms
Recognizing rounding tops and bottoms can be challenging, but there are key points of recognition that traders can use. One common indication is when the price reaches its highest point, experiences a sharp drop, and then starts to gradually rise or fall, forming a gentle curve.
Additionally, observing volume fluctuations after the initial sharp move can provide valuable insights. As the angle of ascent or descent flattens, the volume should decrease significantly. It’s also essential to pay attention to support or resistance points that may mark the beginning of a rounding pattern.
Implications of Rounding Tops and Bottoms
Understanding the implications of rounding tops and bottoms is crucial for analyzing future forex prices. A rounding bottom pattern suggests that a downtrend may be coming to an end, indicating the potential for an upward movement in the near future.
Conversely, a rounding top pattern signals that an uptrend has reached a resistance point and could be heading for a downturn. By grasping the importance of these chart patterns, traders can position themselves strategically to capitalize on price movements and make informed trading decisions.
Strategies for Trading with Rounding Tops and Bottoms
When trading with rounding tops and bottoms in mind, several strategies can increase the chances of success. One popular approach is to wait for the pattern to complete and then enter the market on the breakout above the resistance level.
Setting a stop loss below the bottom of the handle, the lowest point of the pattern helps manage risk. Traders can also determine their profit target by measuring the height of the pattern and extending that distance from the breakout point. Risk management is crucial, and following a well-defined trading plan can help traders minimize potential risks.
Example of Rounding Bottoms Pattern

Example for Rounding Tops Pattern

Managing Risk with Rounding Tops and Bottoms
Effectively managing risk is essential when dealing with rounding tops and bottoms. Placing stop losses at the low points of the bottom or the high points of the top provides protection in case the pattern fails. Utilizing trailing stops, which adjusts with market trends, can help cut losses if necessary.
Setting a minimum target profit amount before entering a trade ensures a clear profit objective. It’s important to remember that when prices change direction, they may not return to the previous range, making strategy and analysis crucial in risk management.
Rounding Tops and Bottoms: Statistics and Performance
Analyzing the performance of rounding tops and bottoms can provide valuable insights for traders. According to statistical data, the average rise and decline for rounding bottoms are 55% and 17%, respectively, while for rounding tops, the average rise is 17% and the decline is 55%. The percentage of price targets met for rounding bottoms is 58%, compared to only 14% for rounding tops.
It’s important to note that tall patterns tend to perform better than short ones, and heavy breakout volume suggests better overall performance.
The Measure Rule and Trading Tips
The measure rule is a valuable tool for trading with rounding tops and bottoms. By computing the height from the highest peak in the pattern to the right rim low, traders can multiply it by the percentage meeting the price target to determine a target price. Another strategy is to buy when prices retrace 32% of the rounding top’s height, indicating a potential opportunity. Support areas, height, breakout volume, and the position of the right rim compared to the left rim are also factors to consider when developing trading strategies.
Conclusion
Rounding tops and bottoms are valuable tools in technical analysis, allowing traders to identify potential reversal points and make informed trading decisions. By understanding the characteristics, identification guidelines, implications, and trading strategies associated with these patterns, traders can enhance their ability to navigate both rising and falling markets. Remember, thorough research and analysis are essential, and risk management should always be a priority in trading endeavors.
Prove your trading skills first, and pay the rest upon success. Get up to 100% profit share on a $250,000 account.
- 8 Best Prop Firms USA: Real trader Reviews and Payouts - March 10, 2025
- Forex Trading in Uganda: Start With $10—An Incredible Opportunity on a Tight Budget! - February 24, 2025
- Master Forex Trading Algorithms: Your Path to Success in 2025 - February 17, 2025


