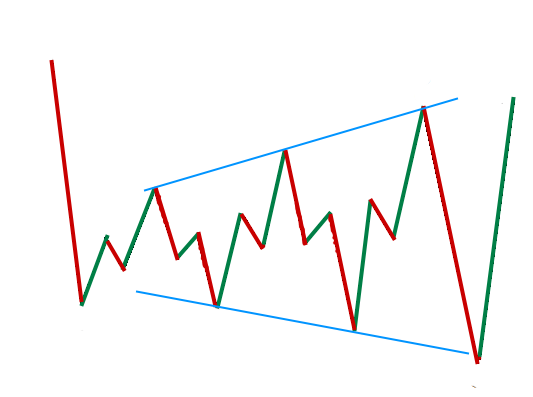
What do we know about price? It is either moving up or down or sideways. Charts have a fancy way of capturing the motion signaling a continuation or reversal.
Continuation chart patterns are at the heart of trading trends; they capture a price consolidation on its way to the trend’s direction.
With only trendlines, naked chart traders jump into the trend when price breaks out.
We’ll consider 7 of the best trend continuation chart patterns in this article.
Please read our article on the reversal chart patterns to complete the equation to help you get into reversals when they’re still hot.
Three things to note about trend continuation chart patterns.
- They form during a trend (uptrend or downtrend)
- Price consolidates and moves sideways to form these patterns
- When price breaks out of the pattern, it always continues in the direction of the original trend.
Bullish Continuation Chart Patterns
Bullish continuation chart patterns appear in an uptrend.
With the help of trendlines, they are easy to spot on any chart.
Here are the major bullish continuation patterns.
Ascending triangle

The ascending triangle pattern is a result of price consolidating in an uptrend.
Price rises to establish a new high, it retraces then bounces up again, at the level of the first high it will drop, but it will print a higher low, this will continue until it breaks out.
If you draw trendlines capturing the tops and another tracing the lows, you will see a triangle pattern.
How to trade the Ascending Triangle chart pattern
Notice when the candlesticks start to shrink into the triangle.
Place a pending buy order a few pips above the upper trendline.
Place the stop loss anywhere below the lower trendline.
Get out or set the take profit limit at the next likely resistance level.
Bullish Pennant
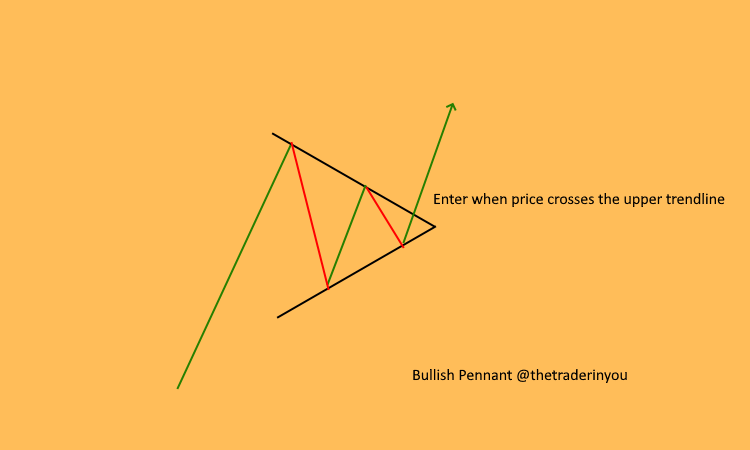
Quite often, price shoots up without notice. When it does, a bullish pennant is what to look for to determine if it will continue upwards.
Price shoots up to levels higher than the candles on the left, briefly consolidates printing higher lows and low highs, forming a triangle when connected with trendlines.
After the brief consolidation, price will rapidly break out of this triangle upwards.
The bullish pennant is also known as the triangular pattern, but don’t mistake it for the much larger symmetrical triangle pattern.
How to trade The bullish pennant continuation pattern
Only look for the bullish pennant after a rapid price hike.
Place a pending buy order a few pips above the upper trendline.
Place the stop loss anywhere below the lower trendline.
Exit the trade at the next likely resistance level.
Bullish Flag
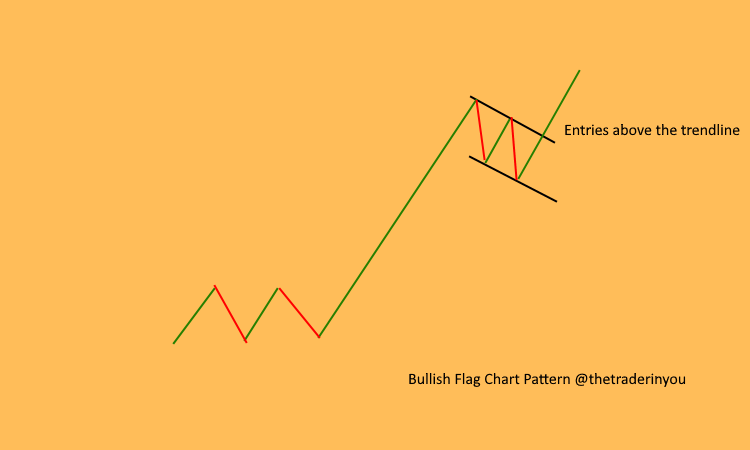
Like the bullish pennant pattern, the bullish flag forms after a sudden price jump.
Price pauses printing lower lows and lower highs.
When you draw a trendline connecting the lows and another connecting the highs, you will see what looks like a flag.
Price often shoots up above the upper trendline continuing with the bullish run.
How to trade the bullish flag chart pattern
Like the bullish pennant, Only look for the bullish flat after a rapid price hike.
Place a pending buy order a few pips above the upper trendline.
Place the stop loss anywhere below the lower trendline.
Exit the trade at the next likely resistance level or based on your RR.
The Bullish Rectangle pattern

The bullish rectangle pattern forms when an uptrend stalls creating new support and resistance levels.
The price will go sideways, printing highs at the resistance levels and lows at the support level.
Draw a trendline joining the highs and another joining the lows to see how the highs and lows are almost parallel.
The bullish rectangle pattern’s beauty is that both range traders and breakout traders will find it tremendously useful.
How to trade the bullish rectangle chart pattern
Entry: For a range trader, sell at the resistance level, buy at the support level.
For the positional and breakout trader, set a pending buy order above the resistance level.
Place a pending buy order a few pips above the resistance level
Place the stop loss anywhere below the support level for the buys and above the resistance level for sell orders.
Exit. The range trader exits when price hits the support and resistance levels.
Positional and breakout traders can exit at the next resistance level or based on your RR.
The Bearish Continuation Chart Patterns
When the market is in a downtrend, look through these bearish continuation patterns for possible entries.
Descending Triangle

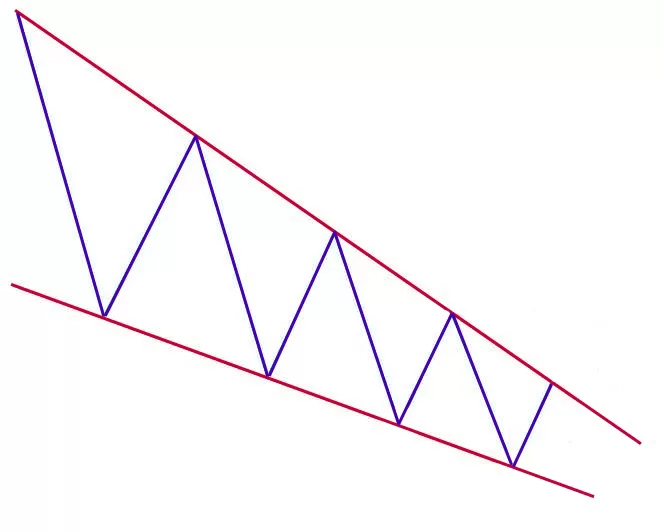
The descending triangle pattern is a bearish continuation chart pattern that forms in a downtrend.
The descending triangle is visible when the upper trendline that joins the highs intersects with the trendline that joins the lows.
The trend continuation is confirmed once the price breaks out below the lower trendline.
How to trade the descending Triangle chart pattern
Notice when the candlesticks start to shrink into the triangle.
Place a pending buy order a few pips below the lower trendline.
Place the stop loss anywhere above the upper trendline.
Get out or set the take profit limit at the next likely support level.
Bearish Pennant
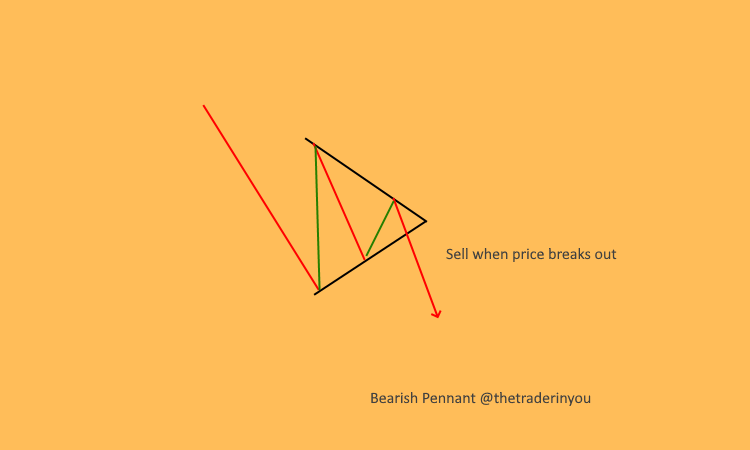
The bearish pennant prints when the price falls sharply.
Price momentarily consolidates, printing lower lows and lower highs before breaking out to the downside.
How to trade The bearish pennant continuation pattern
Only look for the bearish pennant after a rapid price drop.
Place a pending buy order a few pips below the lower trendline.
Place the stop loss anywhere above the upper trendline.
A safe place to exit the trade is at the next likely support level or based on your RR.
The Bearish Rectangle Chart Pattern
The bearish rectangle chart pattern is a graphical representation of the sideways movement of price during a downtrend.
Price takes a break forming a support and resistance level from where price ping pongs before the bears resume the downtrend.
Like the bullish rectangle, breakout, positional, and range, traders can find the bearish rectangle chart pattern useful.

How to trade the bearish rectangle chart pattern
Entry: For a range trader, sell at the support level, buy at the resistance level.
For the positional and breakout trader, set a pending sell order below the support level.
Place the stop loss anywhere below the support level for the buys and above the resistance level for the sells.
Exit. The range trader exits when the price hits the support and resistance levels.
Positional and breakout traders can exit at the next support level or based on your RR.
Last thoughts on forex trend continuation chart patterns
Continuation chart patterns are good indicators naked chart traders use to get in and get out of trades.
This article has hopefully helped you to know what to look out for before jumping into a trend.
In a nutshell, to trade continuation chart patterns
- Identify the areas a trend consolidates at.
- Draw trendlines at the highs and lows.
- Set pending orders in breakout areas – below the trendline for sells and above the upper trendline for sales.
- Place your stop loss a few pips below or above your trendlines.
- Exit the trade at the next support or resistance levels.
- Trade with sound risk management.
- 7 Forex Trend Continuation Chart Patterns - March 2, 2021
- The Psychology of Trading Right and Consistently. - January 2, 2019

