The forex market is known for its various chart patterns traders use to predict market movements. One such pattern is the pennant pattern. In this comprehensive guide, we will explore what a pennant pattern is, how it works in forex trading, and how traders can effectively use it to make informed trading decisions.
What is a Pennant Pattern?
A pennant pattern is a continuation chart pattern that appears after a significant price move in the forex market. It is characterized by a sharp upward or downward movement, a brief consolidation period, and a resumption of the original trend. The consolidation period forms a small symmetrical triangle known as a pennant. Depending on the direction of the preceding price move, pennant patterns can be classified as either bullish or bearish.
Key Characteristics of a Pennant Pattern
To effectively recognize a pennant pattern, traders should be aware of its key characteristics:
- Flagpole: A pennant pattern always begins with a flagpole, which is the initial strong move that precedes the consolidation period. The flagpole differentiates the pennant pattern from other patterns, like the symmetrical triangle.
- Breakout Levels: A pennant pattern has two breakout levels. The first breakout occurs at the end of the flagpole, while the second breakout happens after the consolidation period. These breakouts indicate the continuation of the trend in the same direction.
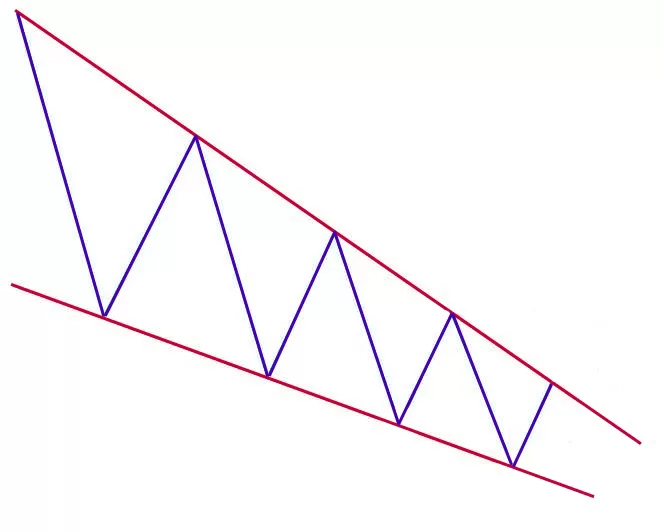
- The Pennant: The consolidation period between the flagpole and the breakout forms the triangular pattern known as the pennant. Two converging trendlines characterize it.
Bullish Pennants in Forex Trading
Bullish pennants are continuation patterns that occur in strong uptrends. They indicate that after a brief consolidation period, the bullish momentum is likely to resume. An upward flagpole, a consolidation period, and a breakout to the upside form a bullish pennant.
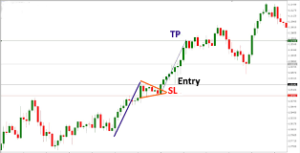
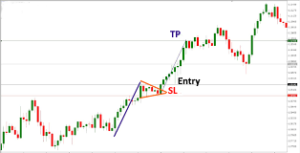
Traders can effectively trade bullish pennants by looking for a break above the pennant to confirm the renewed bullish momentum. This breakout can serve as an entry point for long positions. Setting a stop loss below the pennant or the breakout candle can help limit downside risk. To set target levels, traders can measure the distance from the beginning of the flagpole to the pennant and duplicate this distance from the breakout point.
Trading the Bullish Pennants Chart Pattern
Bearish Pennants in Forex Trading
Bearish pennants are the opposite of bullish pennants and occur in strong downtrends. They signal that after a brief consolidation period, the bearish momentum is likely to continue. A downward flagpole forms a bearish pennant, a consolidation period, and a breakout to the downside.
Traders can trade bearish pennants by looking for a break below the pennant to confirm the continuation of the downtrend. This breakout can serve as an entry point for short positions. Setting a stop loss above the pennant or the breakout candle can help limit potential losses. Similar to bullish pennants, target levels can be set by measuring the distance from the beginning of the flagpole to the pennant and duplicating this distance from the breakout point.
Trading the Bearish Pennants Chart Pattern
Distinguishing Pennant Patterns from Triangle Patterns
While pennant patterns are similar to triangle patterns, there are some important differences that traders should be aware of to trade these patterns effectively. Understanding these differences can help traders differentiate between a pennant and a triangle pattern.
Flagpole Requirement
One key difference between pennant patterns and triangle patterns is the flagpole requirement. A pennant pattern must be preceded by a strong upward or downward move that resembles a flagpole. If there is no flagpole, then the pattern is more likely to be a triangle rather than a pennant.
Retracement Depth
Another difference lies in the retracement depth. A pennant pattern typically forms a shallow retracement, usually less than 38% of the flagpole. A deep retracement is more indicative of a triangle rather than a pennant.
Trend Continuation
Pennant patterns are characterized by the continuation of the upward or downward trend. After the consolidation period, the price will likely resume the original trend. Triangle patterns, on the other hand, may not necessarily exhibit this trend continuation characteristic.
Timeframe
Pennant patterns are short-term patterns usually completed within one to three weeks. In contrast, triangle patterns typically take much longer to form.
Trading Strategies for Pennant Patterns
When trading pennant patterns, there are several strategies that traders can employ to maximize profits and manage risk. These strategies can be applied to both bullish and bearish pennant patterns.
Breakout Confirmation Strategy
One effective strategy is to wait for a breakout confirmation before entering a trade. Traders can set a buy order above the upper trendline for bullish pennants or a sell order below the lower trendline for bearish pennants. This strategy ensures that the breakout is confirmed before entering the trade.
Retest Strategy
Another strategy is to wait for a retest of the breakout level before entering a trade. This strategy adds an additional layer of confirmation to ensure the validity of the breakout. Traders can wait for the price to retest the breakout level and then enter a trade once the retest is successful.
Stop Loss and Take Profit Levels
Setting appropriate stop loss and take profit levels is crucial when trading pennant patterns. Traders can consider placing their stop loss at the opposite end of the pennant pattern to limit potential losses. Take-profit levels can be set by using the height of the flagpole to estimate the size of the breakout move.
Conclusion
The pennant pattern is a valuable tool for forex traders to identify potential trend continuation or reversal opportunities. By understanding the characteristics of a pennant pattern and employing effective trading strategies, traders can make more informed trading decisions.
It is important to remember that no trading pattern is foolproof, and prudent risk management should always be practiced. By combining technical analysis with sound risk management principles, traders can increase their chances of success in the forex market.
Whether you’re a seasoned trader or just starting, Funded Engineer will offer you a gateway to financial growth with a trading account of up to $300k.
- 8 Best Prop Firms USA: Real trader Reviews and Payouts - March 10, 2025
- Forex Trading in Uganda: Start With $10—An Incredible Opportunity on a Tight Budget! - February 24, 2025
- Master Forex Trading Algorithms: Your Path to Success in 2025 - February 17, 2025


