The rising wedge pattern is a widely recognized technical chart pattern used by traders and investors to identify potential trend reversals in the market. It is categorized as a bearish reversal pattern and is often observed after a sustained uptrend. Understanding how to recognize and trade the rising wedge pattern can provide valuable insights for market entry and exit strategies.
In this comprehensive guide, we will delve into the key characteristics of the rising wedge pattern, its formation, the signals it provides, and how to trade it effectively. We will also explore its variations, such as the rising wedge as a continuation pattern, its reliability, and the assets commonly traded using this pattern. So, let’s dive in and explore the fascinating world of the rising wedge pattern.
What is the Rising Wedge Pattern?
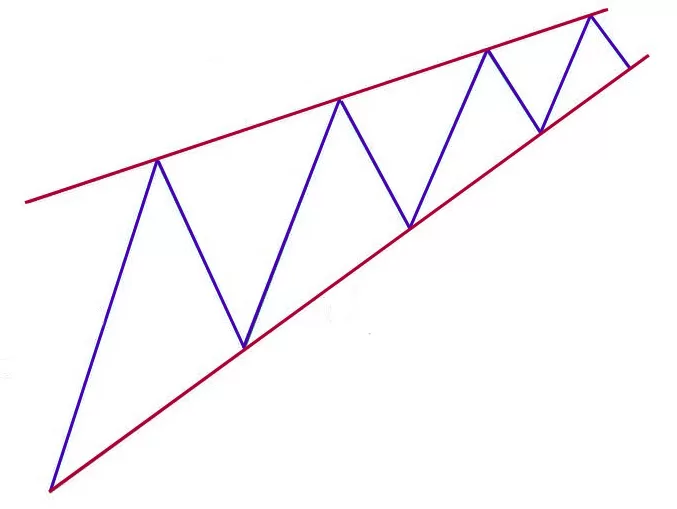
The rising wedge pattern is a bearish chart formation after an uptrend. It is characterized by two converging trendlines, with both the support and resistance trendlines sloping upwards. However, the slope of the support line is usually steeper than that of the resistance line, leading to a convergence of the two lines over time.
The pattern is referred to as a “rising wedge” because the resulting shape resembles a gradually narrowing wedge. It is often accompanied by decreasing trading volume, which further strengthens its bearish signal. The rising wedge pattern is considered a reversal pattern, indicating a potential shift from an uptrend to a downtrend in the asset price.
Key Characteristics of a Rising Wedge Pattern
To effectively recognize and trade the rising wedge pattern, it is essential to understand its key characteristics. These characteristics help distinguish the rising wedge pattern from other chart patterns and provide valuable insights into its predictive power. Let’s explore the key characteristics of the rising wedge pattern:
1. Upward Trend: The rising wedge pattern typically forms during an upward price movement or uptrend. It indicates a potential reversal in the security’s price.
2. Converging Trendlines: The rising wedge pattern is characterized by two converging trendlines. The support and resistance trendlines slope upwards, but they gradually converge over time.
3. Volume: A declining volume often accompanies the formation of the rising wedge pattern. The decreasing trading volume suggests a loss of buying momentum and reinforces the pattern’s bearish signal.
4. Breakout: Confirmation of the rising wedge pattern occurs when the price breaks below the lower support trendline. This breakout below the support line signals a potential bearish reversal.
Trading the Rising Wedge Pattern
Trading the rising wedge pattern involves strategically capitalizing on its bearish reversal signal. To successfully trade the rising wedge pattern, traders and investors must identify it, confirm its validity, determine entry and exit points, manage risk, and develop an effective exit strategy. Let’s explore the step-by-step approach to trading the rising wedge pattern:
1. Identification: The first step is to identify the rising wedge pattern on the chart. Traders and investors should look for converging, upward-sloping trendlines with higher highs and lows. The pattern usually forms during an uptrend.
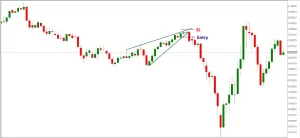
2. Confirmation: Before entering a trade, it is crucial to wait for confirmation of the rising wedge pattern. Confirmation typically comes in the form of a price breakout below the lower trendline. Additionally, a declining volume during the formation of the wedge can serve as an additional confirmation signal.
3. Entry Point: Once the pattern is confirmed, traders often enter a short position. The breakout point below the lower trendline serves as the entry point for the trade.
4. Stop Loss: To manage risk, traders should set a stop loss just above the last high within the pattern. This helps minimize potential losses if the pattern fails and the price reverses into an uptrend.
5. Price Target: Determining a price target is essential for trade planning. The price target for the trade is usually calculated by measuring the height of the pattern at its widest point and subtracting that value from the breakout level. Some traders may also use Fibonacci retracement levels as additional targets.
6. Risk Management: Risk management is critical when trading the rising wedge pattern. Traders should set appropriate position sizes and use other technical analysis indicators to validate the pattern, such as the Relative Strength Index (RSI) or Moving Average Convergence Divergence (MACD).
7. Exit Strategy: Traders usually exit the position once the price reaches the predetermined target. However, it is advisable to monitor other technical analysis indicators and market news that could influence price action.
Variations of the Rising Wedge Pattern
While the rising wedge pattern is generally considered a bearish reversal pattern, it can also act as a continuation pattern or exhibit variations depending on specific market conditions. Let’s explore the variations of the rising wedge pattern:
Rising Wedge as a Continuation Pattern: In certain market conditions, the rising wedge pattern can act as a continuation rather than a reversal pattern. When it serves as a continuation pattern, it typically occurs during a downtrend instead of an uptrend. The rising wedge as a continuation pattern suggests that the market sentiment remains bearish, and the temporary upward movement within the wedge is seen as a consolidation phase before the market continues its downward trajectory.
FAQS
What is the best timeframe to Use the Rising Wedge Pattern?
The effectiveness of the rising wedge pattern can vary depending on the timeframe used for analysis. The choice of the best timeframe also depends on the asset being traded, its volatility, and the trader or investor’s strategy and risk tolerance.
Shorter timeframes, such as intraday charts (e.g., 15-minute or 30-minute charts), are often used by day traders seeking quick profits from short-term price movements. Medium-term traders may opt for hourly or 4-hour charts, while long-term investors may analyze daily or weekly charts to capture broader market trends.
How reliable is the Rising Wedge Pattern?
As with any technical pattern, the reliability of the rising wedge pattern is a subject of debate among traders and investors. While the rising wedge pattern is widely recognized for its predictive power, it is important to note that no pattern is 100% reliable.
Conclusion
The rising wedge pattern is a valuable tool for traders and investors seeking to identify potential trend reversals in the market. By understanding the key characteristics of the pattern and following a systematic approach to trading it, traders can capitalize on its predictive power.
Remember, the rising wedge pattern is not infallible, and it is crucial to use it with other technical indicators and market analysis. Continuously refine your trading strategy, manage risk effectively, and stay informed about market conditions to make informed decisions when trading the rising wedge pattern.
With this comprehensive guide, you are well-equipped to recognize, trade, and leverage the rising wedge pattern to enhance your trading and investment outcomes. Happy trading!
Start your trading journey with Funded Engineer and receive an account of up to $250k. The profit share is 90% to the trader.
- 8 Best Prop Firms USA: Real trader Reviews and Payouts - March 10, 2025
- Forex Trading in Uganda: Start With $10—An Incredible Opportunity on a Tight Budget! - February 24, 2025
- Master Forex Trading Algorithms: Your Path to Success in 2025 - February 17, 2025


