If you’ve been exploring the world of trading for a while, you might have come across the term “Three Inside Down”. But what exactly does it mean? In this guide, we delve into the details of the Three Inside Down candlestick pattern, its implications, and how to use it in your trading strategy effectively.
What is the Three Inside Down Pattern?
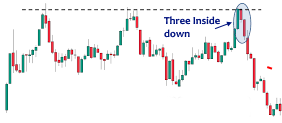
The Three Inside Down pattern is a three-candle formation that typically appears in an uptrend and signals a potential bearish reversal. This pattern is considered a reliable indicator of a shift in market sentiment from bullish to bearish.
The Basic Structure
The Three Inside Down pattern comprises three different candlesticks. Here’s the breakdown:
- First candle: This is a bullish (white or green) candle that appears during an uptrend.
- Second candle: We have a bearish (black or red) candle following the first. The body of this candle is engulfed by the first one, indicating a change in market sentiment.
- Third candle: The final candlestick is also bearish, and its closing price is lower than that of the second candle. This candle confirms the bearish reversal signaled by the pattern.
Please note:
The color of the candles might vary depending on the charting platform you’re using. Some platforms use green for bullish and red for bearish, while others use white for bullish and black for bearish.
Recognizing the Three Inside Down Pattern
Identifying the Three Inside Down pattern involves looking for specific characteristics. This pattern is generally found after a price increase and indicates a rejection of higher prices. While the pattern is bearish, meaning we expect a downward move after its formation, its presence alone does not guarantee a reversal. It’s crucial to consider other market factors and indicators when making trading decisions.
Key Identification Guidelines
To identify the Three Inside Down pattern on a chart, keep an eye out for the following:
- The pattern consists of three candles.
- The first candle is bullish and is part of an uptrend.
- The second candle is bearish, and its body is contained within the body of the first candle.
- The third candle is also bearish, and its closing price is lower than the closing price of the first candle.
Variations of the Three Inside Down Pattern
While the basic structure of the Three Inside Down pattern remains the same, there can be slight variations in its appearance. For instance:
- The second candle might have a long upper wick.
- The second candle may open with a gap above the first candle.
- The second candle’s body may be entirely within the body of the first candle.
These variations do not alter the core meaning of the pattern. The bearish reversal signal remains intact, and the trading strategy applied should be the same.
Trading with the Three Inside Down Pattern
The Three Inside Down pattern can serve as a powerful tool in a trader’s arsenal. However, to trade this pattern effectively, traders need to consider more than just its shape. The location of the pattern is equally, if not more, critical.
When to Open a Trade
Generally, traders open a short position when the price breaks below the low of the third candle (the confirmation candle). This is viewed as a conservative trigger for entering a trade. However, it’s essential to set a stop loss to protect yourself from potential price reversals.
Combining with Other Indicators
For improved accuracy, traders often combine the Three Inside Down pattern with other forms of technical analysis or indicators. For instance, they might use moving averages, resistance levels, or the RSI (Relative Strength Index) to confirm the pattern’s validity and enhance their trading strategy.
Conclusion
The Three Inside Down pattern is a powerful tool in technical analysis. However, it’s crucial that traders understand its structure, know how to identify it, and apply the right strategies when trading with it. Combining the pattern with other technical indicators can significantly enhance its effectiveness and accuracy in predicting price movements.
Remember, while the Three Inside Down candlestick pattern is a robust technical tool, it doesn’t guarantee success on every trade. It’s essential to use a well-planned trading strategy, manage your risk effectively, and remain patient and disciplined when trading.
Get qualified to work for a private equity fund. Trade up to $4,000,000 and receive a profit share of up to 100%
- 8 Best Prop Firms USA: Real trader Reviews and Payouts - March 10, 2025
- Forex Trading in Uganda: Start With $10—An Incredible Opportunity on a Tight Budget! - February 24, 2025
- Master Forex Trading Algorithms: Your Path to Success in 2025 - February 17, 2025


