Diamond Chart Patterns Strategy
Diamond chart patterns are technical analysis patterns that indicate potential trend reversals in the financial markets. These patterns form on price charts and resemble the shape of a diamond.
Rounding tops and bottoms are chart patterns that signify potential reversals in the price trend. A rounding bottom, also known as a saucer or a ‘U’ formation, appears as a gradual increase in price over time, indicating the end of a downtrend and the potential start of an uptrend.
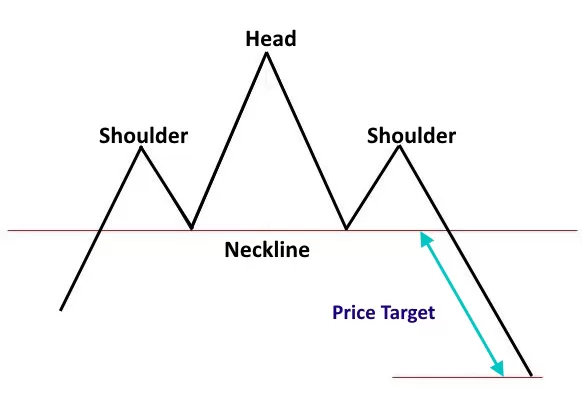
The head and shoulders pattern consists of three main components: the head, the shoulders, and the neckline. It can be seen as a baseline with three peaks, where the middle peak (the head) is higher than the two outer peaks (the shoulders).
The Deliberation pattern is a three-line bearish reversal candlestick formation. It is formed by three green candles, each with specific criteria. The first and second candles of the pattern have long bodies, indicating significant upward momentum.
The Downside Gap Three Methods pattern starts with a long black candle, representing a decrease in price during a downtrend. The second candle also decreases in price and opens below the low of the previous candle, creating a noticeable gap between the two.
The Upside Gap Two Crows pattern consists of three candlesticks and is typically observed in an uptrend. It indicates a potential shift from bullish to bearish market sentiment. This pattern is relatively rare but carries significant implications for traders.
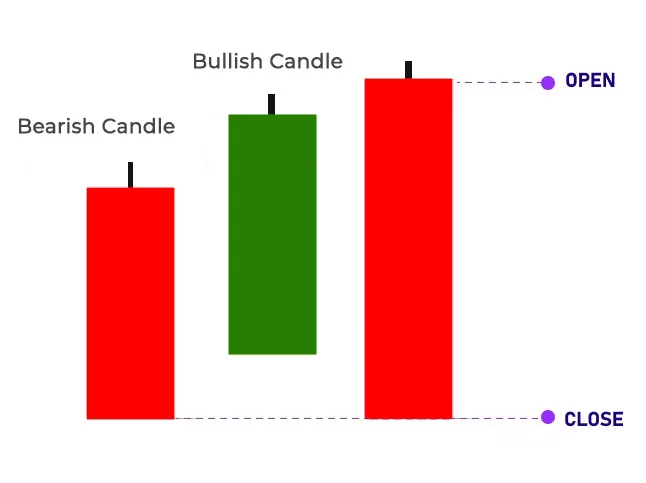
The Kicking Candlestick Pattern is a two-line pattern that can indicate a potential reversal in the prevailing market trend. It consists of a first candle and a second candle, with each candle having specific characteristics depending on whether it is a bearish or bullish Kicking pattern.
The Stick Sandwich Pattern is characterized by a specific arrangement of three candlesticks. The middle candlestick is of a different color than the two flanking candlesticks, which are the same color. The flanking candlesticks also have a larger trading range than the middle one.
The Abandoned Baby is a distinctive three-candle reversal pattern that appears in candlestick charts. The formation of this pattern requires a specific set of price movements, making it relatively rare yet exceptionally reliable when it does occur.
The Evening Doji Star is a bearish reversal pattern that signifies a potential shift in momentum from an uptrend to a downtrend.